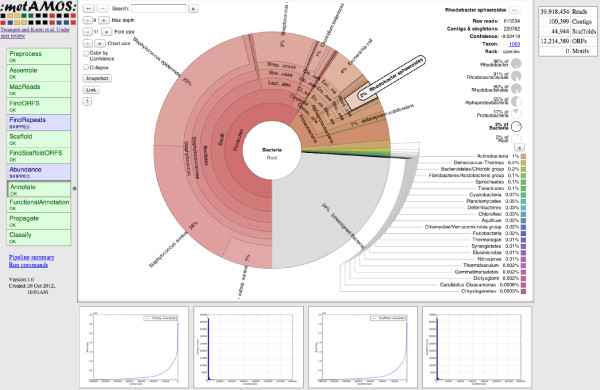
Figure 2.

MetAMOS HTML report interface. The majority of results generated during the pipeline are exposed to the user via an interactive HTML report. From left to right. Pipeline status: this lists the state (OK, FAIL, SKIP) for each step in the pipeline. In addition, each individual step is linked to an image/text summary of the results generated during this step. Krona plot: by default, in the main section of the report an interactive Krona plot of the annotations is displayed. This main section is dynamically updated with content from the other steps at the user's request. Single/Multiple Sample plots: This section is dedicated to displaying automatically generated R plots of assembly statistics. If multiple samples are available, they can be combined into a single plot. Quick summary: this column, as the name implies, provides a very brief overview of the results (listing in descending order number of reads, contigs, scaffolds, ORFs, variants) in addition to linking to a file containing a summary of all of the executed commands for the MetAMOS run.
