
Figure 5.
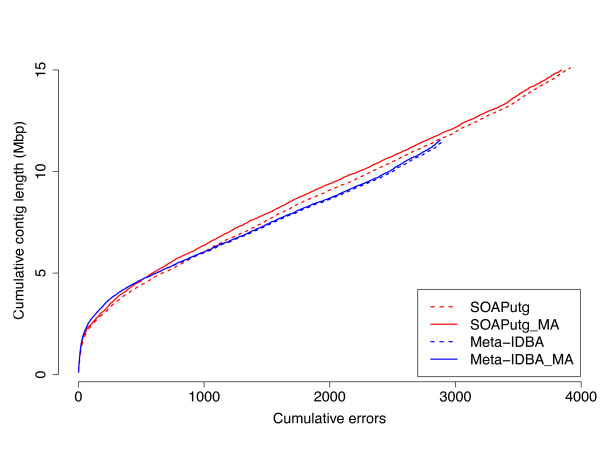
Feature response curve for the HMP tongue dorsum sample. The y-axis shows the cumulative contig length (sorted in decreasing order) and the x-axis shows cumulative errors. Curve includes all errors (slight, heavy, chimera; see text for more details).