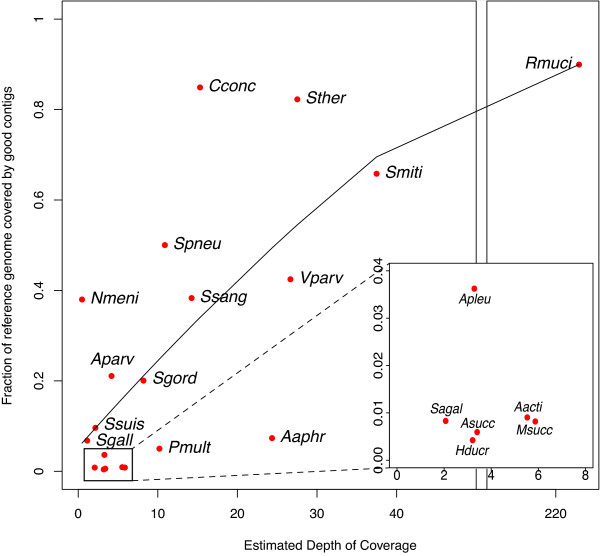
Figure 6.

Comparing depth of coverage versus percentage of reference covered by assembly on the HMP tongue dorsum sample. The points represent individual reference genomes similar to the organisms in the sample. The x-axis represents the estimated depth of coverage while the y-axis represents the breadth of coverage (percentage of the reference covered by correctly assembled contigs). The coverage and percent-assembled values are significantly correlated (Spearman correlation coefficient 0.66, P = 0.002). A regression line is calculated using R scatter.smooth() function with a Gaussian model and span = 1.2. Genome names are abbreviated as follows: Aacti, Aggregatibacter actinomycetemcomitans D11S-1; Aaphr, Aggregatibacter aphrophilus NJ8700; Apleu, Actinobacillus pleuropneumoniae serovar 7 str. AP76; Aparv, Atopobium parvulum DSM 20469; Asucc, Actinobacillus succinogenes 130Z; Cconc, Campylobacter concisus 13826; Hducr, Haemophilus ducreyi 35000HP; Msucc, Mannheimia succiniciproducens MBEL55E; Nmeni, Neisseria meningitides ATCC 13091; Pmult, Pasteurella multocida subsp. multocida str. Pm70; Rmuci, Rothia mucilaginosa DY-18; Sagal, Streptrococcus agalactiae 18RS21; Sgall, Streptococcus UCN34; Sgord, Streptococcus gordonii str. Challis substr. CH1; Smiti, Streptococcus mitis B6; Ssang, Streptococcus sanguinis SK36; Ssuis, Streptococcus suis BM407; Spneu, Streptococcus pneumonia AP200; Sther, Streptococcus thermophilus LMD-9; Vparv, Veillonella parvula DSM 2008.
