
Figure 3.
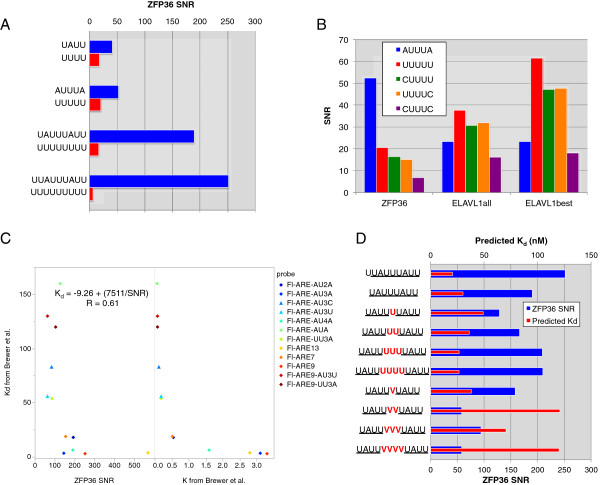
In vivo ZFP36 binding specificity. (A) SNR values for specific motif occurrences within ZFP36 3′ UTR sites relative to the background. (B) Comparison of SNR values for indicated pentamer sequences in ZFP36 sites, all ELAVL1 sites (ELAVL1all), as well as the highest read count (ELAVL1best) subset of all ELAVL1 sites. (C) Comparison of SNR values with K and Kd of probe sequences (in different colors) determined using fluorescence anisotropy experiments [48]. The correlation coefficient and equation for the fit of Kd to the reciprocal of the SNR is indicated. (D) Comparison of SNR values (blue) and predicted Kd (red) of nonamer and octamer sequences, as well as half-sites interrupted by one to four uridylates (U) or a non-uridylate (V = A/C/G). SNR, signal-to-noise ratio.