
Figure 1.
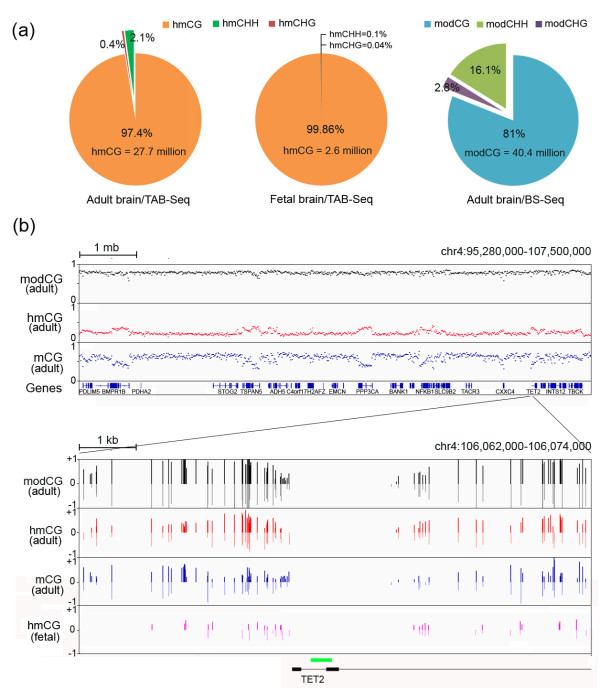
Base-resolution hydroxymethylome and methylome in the human brain. (a) The percentages of hmCs or modCs in the adult or the fetal brain in the contexts of CG, CHH, and CHG. (b) Examples of the hmC, mC, and total modification (hmC + mC) profiles are shown for a genomic region of 12 mb on chromosome 4 as a scatterplot (Upper panel) and for a 12 kb region surrounding the TSS of the TET2 gene as a bar chart. The green box indicates the CpG island located in the TET2 promoter.