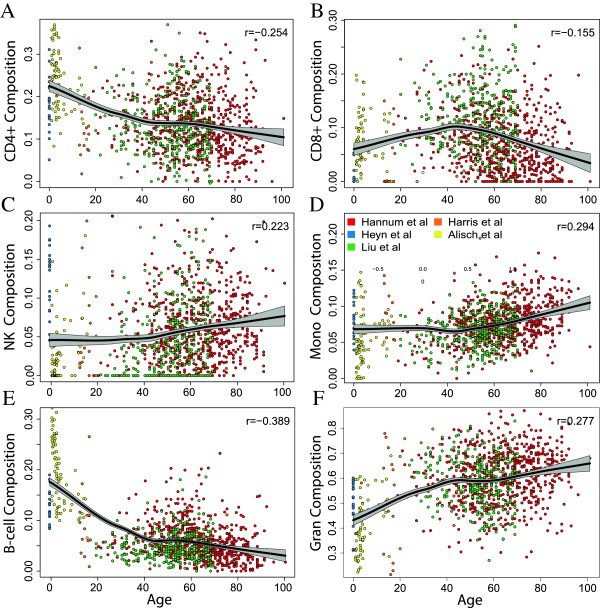
Figure 2.

Cellular composition changes across the lifespan. Estimated cellular composition proportions are plotted against age for (A) CD4+ T cells, (B) CD8+ T cells, (C) natural killer (NK) cells, (D) monocytes (Mono), (E) B cells, and (F) granulocytes (Gran). Color indicates the data source, which are described in Additional file 1. The black lines are curves fit to data with local weighted regression (loess) with confidence intervals in grey. Spearman correlation coefficients are reported for each composition proportion estimate and age.
