
Figure 2.
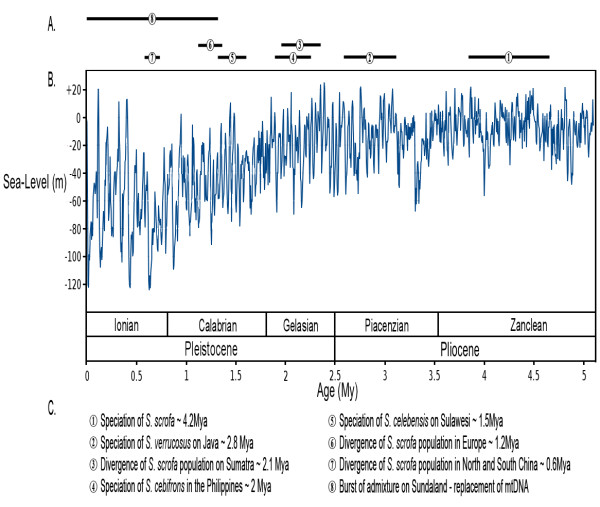
A eustatic curve adapted from [18]. (A) Each black bar shows 95% confidence interval of each divergence event as inferred from molecular clock analysis (Figure 1B). (B) Eustatic curve for the last 5 My. (C) Legend of events represented as black bars in (A).