
Figure 2.
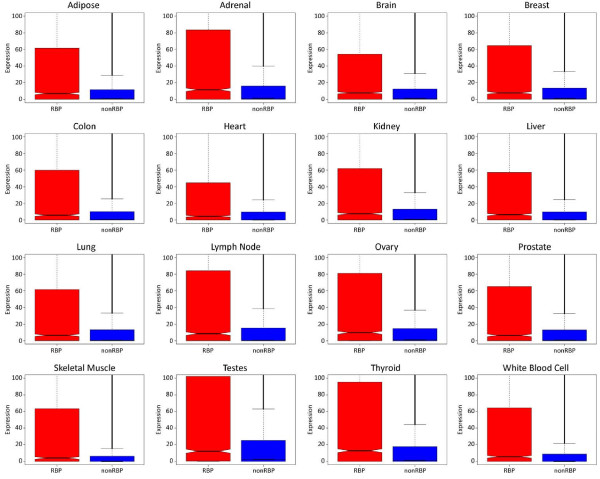
Comparison of expression levels of RNA-binding proteins and non-RNA-binding proteins for 16 tissues from 80 healthy individuals studied in the Human BodyMap project. Each of the 16 plots illustrates the significant differences in expression levels in RBPs (P < 2 × 10-16, Wilcoxon test) across adipose, adrenal, brain, breast, colon, heart, kidney, liver, lung, lymph node, ovary, prostate, skeletal muscle, testes, thyroid, and white blood cell tissues. The x-axis is the category of the observed factor and the y-axis is the expression level. RBP, RNA-binding protein.