
Figure 3.
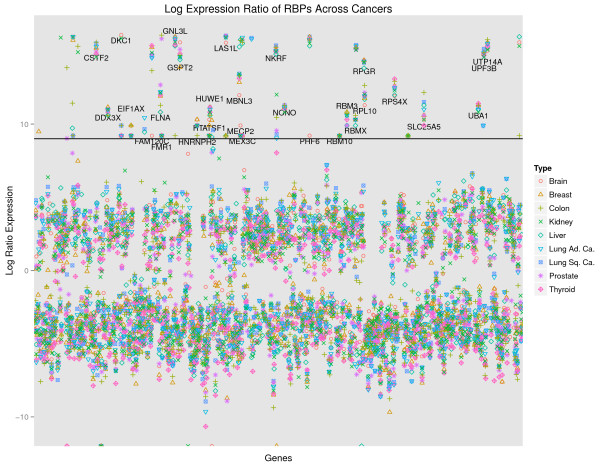
Log-ratio of expression for cancer to healthy expression for RNA-binding proteins in nine human cancers. The x-axis is an index of all the RNA-binding proteins that could be extracted from the expression data in the Cancer Genome Atlas. The y-axis is the ratio of the median expression level for each gene across patients versus the observed expression in the Human BodyMap data. Marked are the 31 strongly upregulated RBPs that have an expression ratio over nine across more than half of the studied cancers. Lung Ad. Ca., lung adenocarcinoma; Lung Sq. Ca., lung squamous carcinoma; RBP, RNA-binding protein.