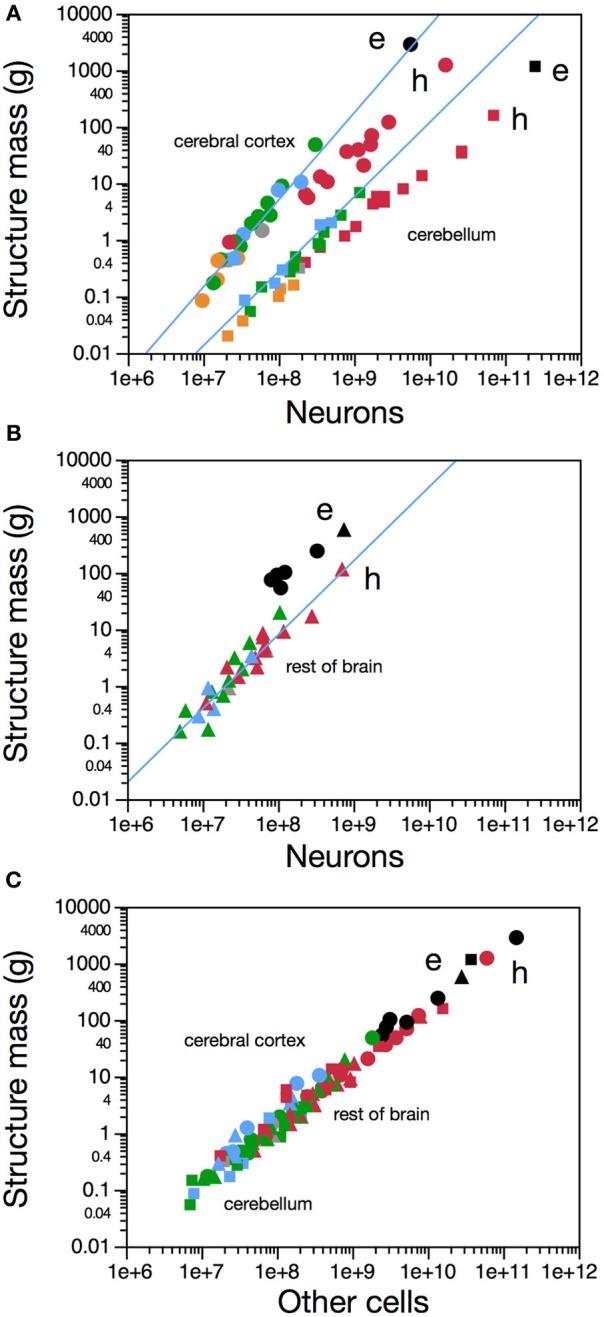
Figure 1.

The African elephant brain has as many neurons in the cerebral cortex as expected for an afrotherian of its cortical mass, but more neurons in the cerebellum than expected for its cerebellar mass, and fewer neurons in the remaining brain areas than expected for their mass. In all figures, each data point represents values for both brain sides in one species. (A) Variation in mass of the cerebral cortex (gray and white matter combined; circles) and of the cerebellum (squares) as a function of the number of neurons in the respective structures. (B) Variation in mass of the remaining brain structures as a function of the number of neurons they contain in each species. (C) Variation in mass of cerebral cortex (circles), cerebellum (squares), and remaining brain structures (triangles) across species as a function of their numbers of non-neuronal (other) cells. Elephant data points shown in black (e), other afrotherian species in blue, primates in red (human, h), eulipotyphlans in orange, and glires in green. Data from (Herculano-Houzel et al., 2006, 2007, 2011; Azevedo et al., 2009; Sarko et al., 2009; Gabi et al., 2010; Neves et al., 2014).
