Figure 5.

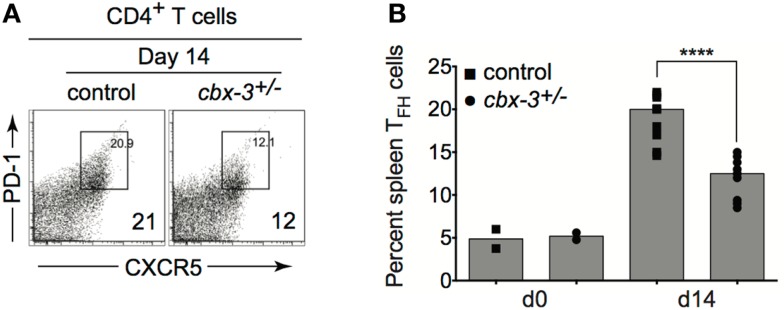
The T follicular helper cell copulation is reduced in cbx-3+/− mice. (A) The frequency of spleen TCRβ+CD4+CXCR5hiPD-1hi TFH population was determined by FACS analysis. Numbers in right bottom corners indicate the percent cells. CXCR5hiPD-1hi TFH cells were gated on the TCRβ+CD4+ population. (B) Plot represents a compilation of the percent of TFH population from (A). Each symbol denotes an individual mouse. Bars represent median. Statistical analysis was performed with GraphPad one-way ANOVA. Day 14, n = 8–12 for each genotype, ****p < 0.0001.
