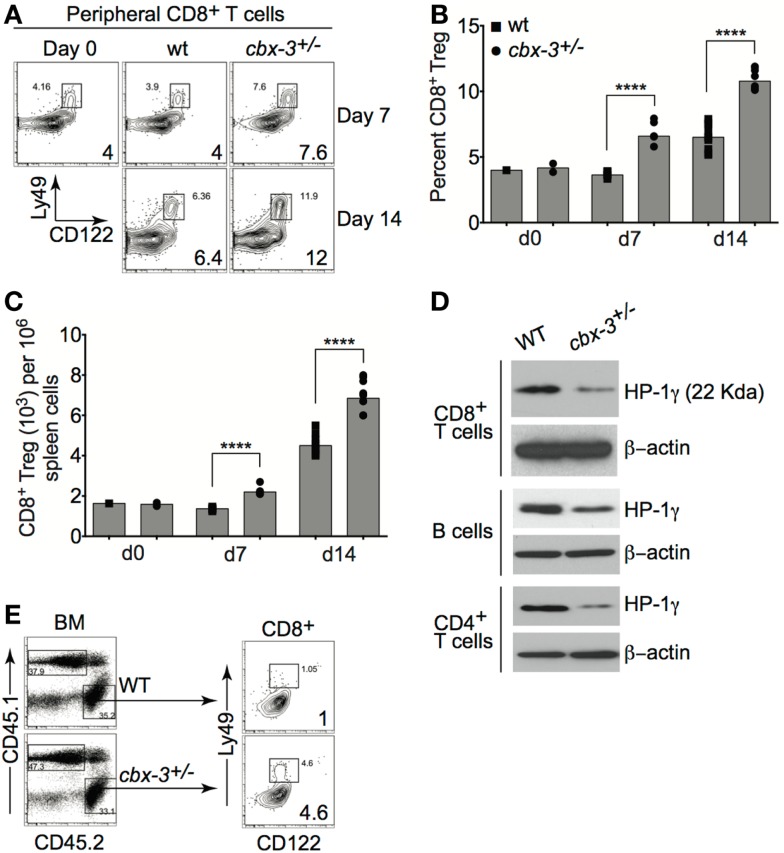
Figure 7.
CD122+Ly49+CD3+CD8+ regulatory T-cell compartment is expanded in cbx-3+/− mice. (A) On days 7 and 14 after immunization, percent of spleen CD122+Ly49+CD3+CD8+ regulatory T-cell (Treg) population from wt littermate and cbx-3+/− mice was assessed by FACS. Numbers in lower right corners indicate percent cells. CD122+Ly49+CD8+ Treg cells were gated on the CD3+ population. (B,C) Plots represent a compilation of the percent and number of CD8+ Treg population from (A). Each symbol denotes an individual mouse. Bars represent median. Statistical analysis was performed with GraphPad one-way ANOVA. Day 7, n = 5 for each genotype; ****p < 0.0001. Day 14, n = 8–12 for each genotype; ****p < 0.0001. (D) Purified CD8+CD44−, CD4+CD25−, and CD43− B cells were collected from spleen and peripheral lymph nodes. Blots were probed with anti-total HP-1γ (22 kDa) and anti-β-actin (42 kDa). Results are representative of two independent experiments; n = 4 mice of each genotype. (E) cbx-3+/+/cbx-3+/− mixed bone marrow chimeras were generated as in Figure 6A. Percent CD8+ Treg cells were determined by FACS. Numbers in lower right corners indicate percent cells. CD45.1 and CD45.2 populations were derived from the lymphoid gate. CD122+Ly49+CD8+ Treg cells were gated on the CD3+ population.

