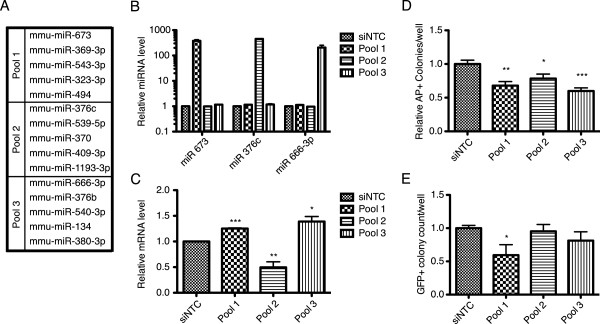
Figure 6.

Effect of Dlk1-Dio3 miRNAs on reprogramming. (A) Three pools of five downregulated miRNAs located within the Dlk1-Dio3 gene cluster. (B) Quantitative PCR of representative miRNAs from pools 1 to 3 to assess transfection efficiency. (C) Quantitative PCR analysis of Thy1 expression 5 days after OSKM infection and miRNA pool transfection. (D) Relative number of AP + colonies per well 12 days after OSKM infection and miRNA pool transfection. (E) Relative number of Oct4-GFP+ colonies per well 14 days after OSKM infection and miRNA pool transfection. siNTC, si no-template control, *p < 0.05, **p < 0.01, ***p < 0.001, determined by two-tailed Student’s t test.
