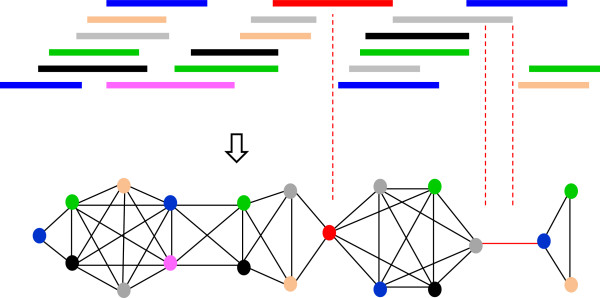
Figure 1.

Network representation of clone overlaps. Top: physical clone overlaps. Bottom: network representation of clones (nodes) and clone overlaps (edges). Colors are used to clarify the correspondence between physical and network representations of clone overlaps. Weak connections (Q-clones and Q-overlaps) caused by low coverage are marked in red. Q-clone, questionable clone; Q-overlap, questionable overlap.
