
Figure 5.
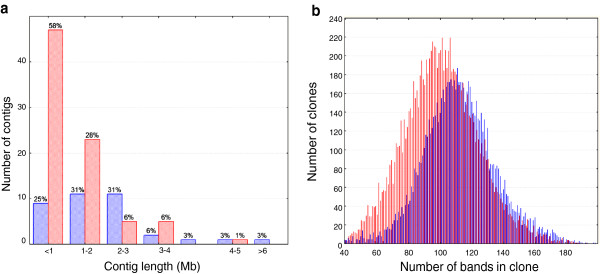
Gradients of contig length and clone band number along the 1BS chromosome. (a) Distribution of length of contigs mapped to the centromeric part of 1BS (deletion bin C-1BS10-0.50, shown in blue) compared to contigs mapped to the telomeric region (deletion bins 1BS.sat5-1.06-0.50 and 1BS.sat18-0.50-1.0, shown in red). (b) Distribution of band number per clone in centromeric (blue) and telomeric (red) regions. BAC, bacterial artificial chromosome; Mb, megabase.