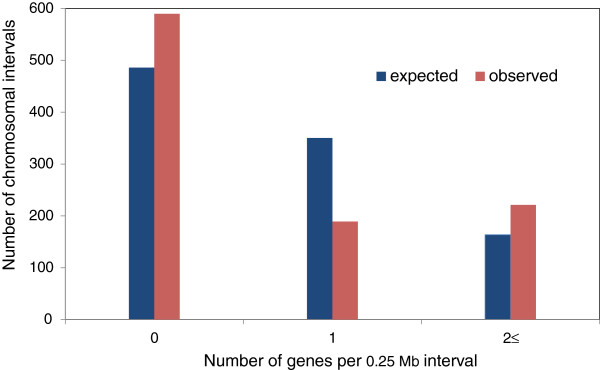
Figure 7.

Non-random distribution of gene density in 1BS. The observed distribution of 0.253 Mb 1BS intervals containing no, single or at least a pair of genes was compared to the expected random distribution; an excess of intervals with two or more genes was revealed. kb, kilobase; Mb, megabase.
