3.
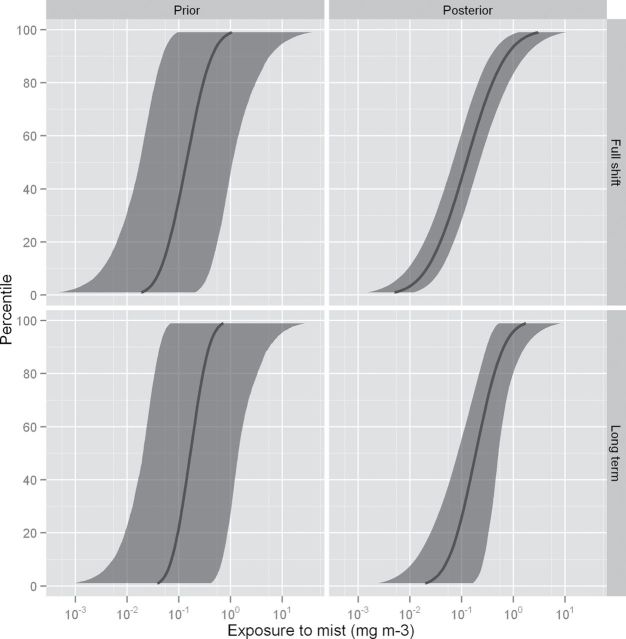
A comparison of the prior and posterior distributions for the full-shift and long-term average cumulative distributions of exposure for copper pyrithione in the antifouling paints example. The solid line represents the central estimate for a given percentile and the shaded region denotes the 90% credible interval.

