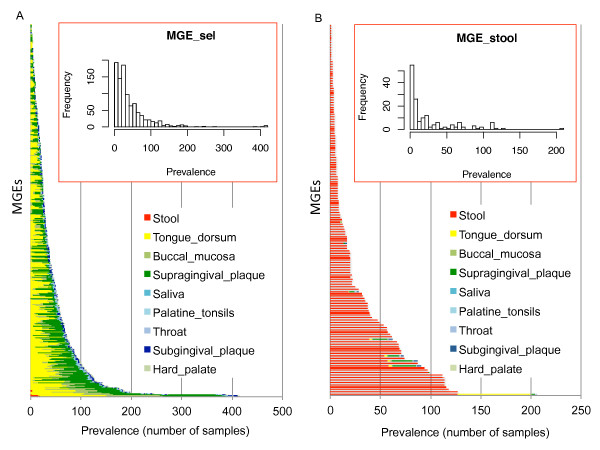
Figure 1.

The distribution of MGEs across HMP samples. A MGE is considered to be present in a sample if 70% of its length is covered by at least one read. The X-axis represents the number of samples that contain each MGE, Y-axis represents MGEs. (A) Distribution of the 959 MGEs each with at least 40 protospacers. (B) Prevalence of 155 MGEs selected from stool microbiomes, each with at least 10 protospacers. The inserts are the histograms of the MGE sizes. MGE, mobile genetic element.
