
Figure 4.
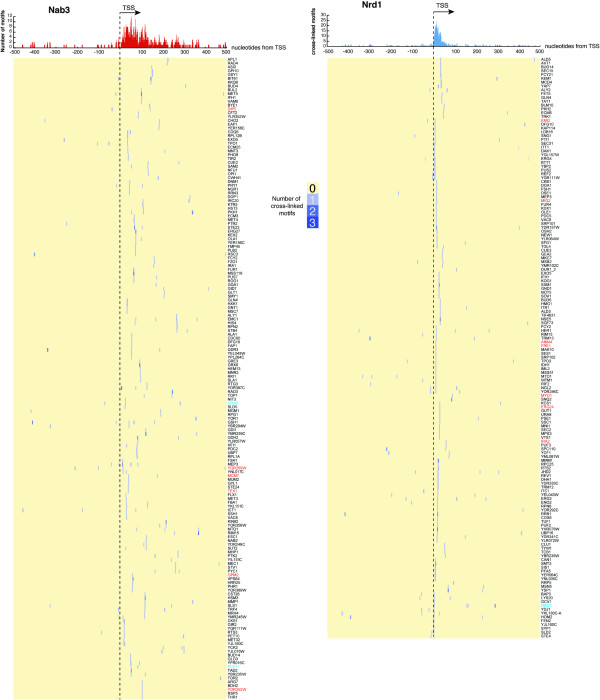
Distribution of cross-linked Nrd1 and Nab3 motifs around transcription start sites. The pileup on top of the heat maps indicates the cumulative distribution of cross-linked motifs within a 500-nucleotide window of transcription start sites. The heat map shows the distribution of cross-linked motifs (blue) within individual transcripts. The dashed line indicates the positions of transcription start sites. Red gene names indicate genes where cryptic transcription was detected upstream, whereas cyan colored gene names indicate transcripts previously shown to be regulated by Nrd1-Nab3-dependent transcription termination.