
Figure 6.
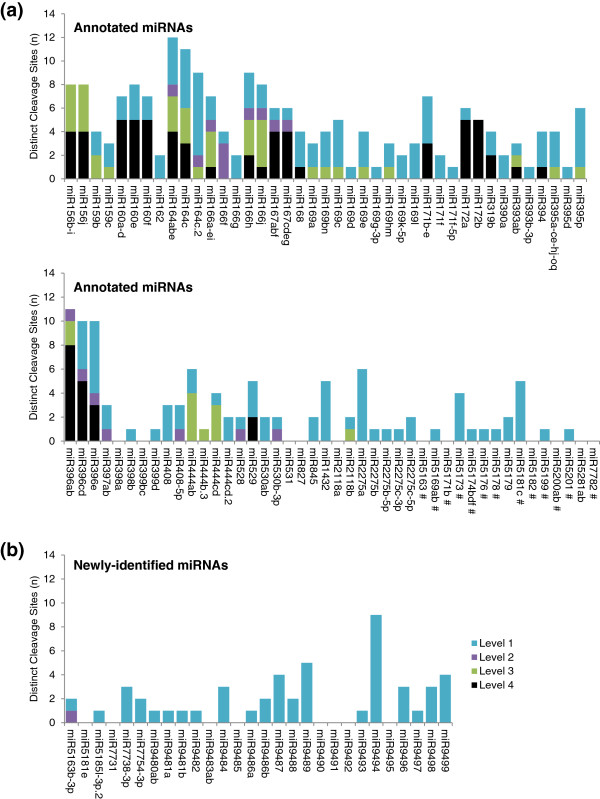
Target prominence level distribution among precise cleavage sites with PARE data. The number of distinct cleavage sites of each of the levels for (a) annotated miRNAs and (b) newly identified miRNAs are shown. miRNAs are listed by families in ascending order as in the supplemental tables. Non-conserved miRNAs are indicated with # in (a). miRNA, microRNA; PARE, parallel analysis of RNA ends.