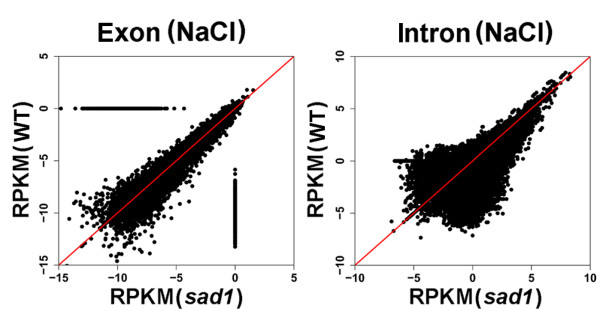
Figure 3.

Comparison of intron retention between the wild type and sad1. The RPKM values for the exons and introns were plotted between the wild type and sad1. The expression of introns in the sad1 mutant shows a global up-regulation, but not that of exons. RPKM, reads per kilobase per million; sad1, sad1 mutant; WT, wild type.
