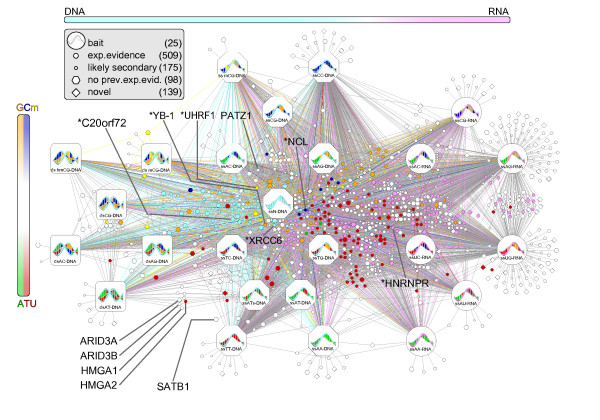
Figure 2.

Overview of the nucleic acid interactome. Baits are indicated by large nodes. Nucleotide composition of the baits and preferential affinity of proteins are color coded according to Figure 1a. In case of multiple substrate preferences for a single protein, only the most significant one is reported. Interacting proteins are split into four groups (known with experimental evidence, likely secondary, no previous experimental evidence, and novel) based on public annotations and interaction databases. Selected proteins that have been experimentally validated (preceded by an asterisk) or are well known are indicated with a color code indicating their inferred or known preferential affinity (dual affinities were arbitrarily assigned one color).
