
Figure 2.
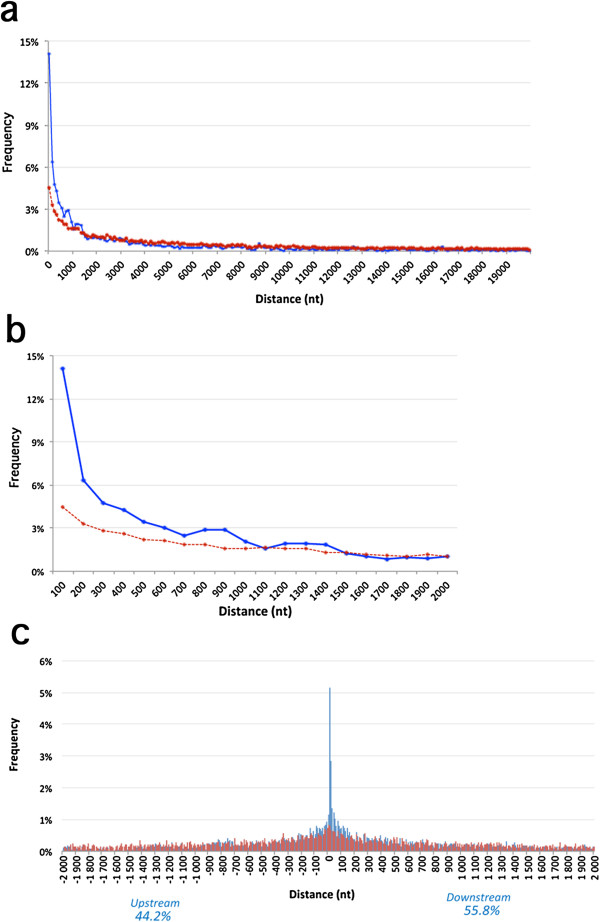
Distance distribution between non-Alu editing sites and nearest edited Alu. The distance from random adenosines is shown as a broken red line. The distances were grouped in bins of 100, and their frequencies were plotted for a distance window of (a) 20 kb and (b) 2 kb. (c) Distance distribution plot with orientation, in bins of 10 nucleotides. Positive and negative distances indicate that the edited Alu is downstream or upstream of the (non-Alu) editing site. Blue bars: distance from editing sites to edited Alus. Red bars: distance from random adenosines to edited Alus. A significant tendency for Alus to be located downstream was observed (P = 3 × 10-16). kb, kilobase; nt, nucleotide.