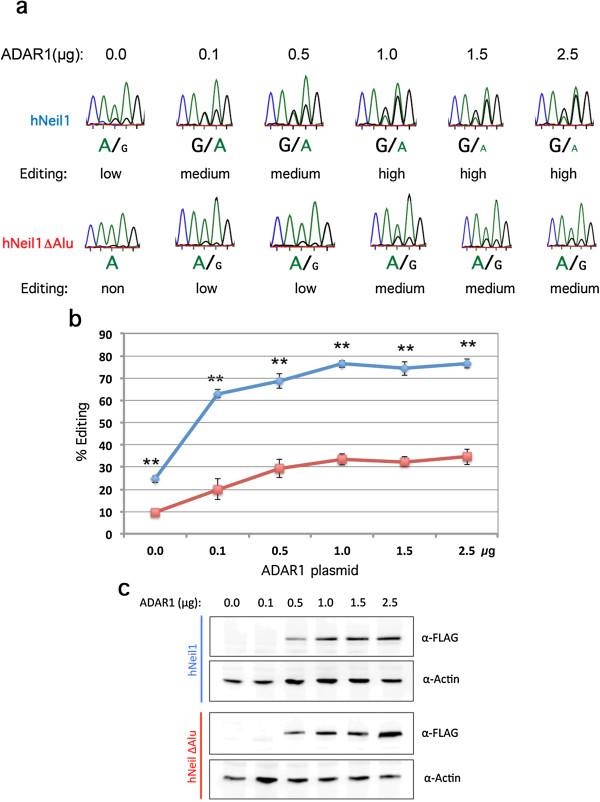
Figure 5.

Titration of ADAR1 co-transfected with hNEIL1 or hNEIL1 ΔAlu in HEK293 cells. (a) Sequencing chromatograms after RT-PCR from ADAR1 and hNEIL1 or hNEIL1 ΔAlu co-transfections. The reporter constructs were constant (1.5 μg) in each experiment and the concentration of ADAR1 was titrated, ranging from 0 to 2.5 μg. (b) Quantification of editing efficiency at the K/R site in hNEIL1 (blue) and hNEIL1 ΔAlu (red) reporters when co-transfected with titrated ADAR1. There were at least triplicates for each concentration. The mean value of the ratio between the A and G peak heights was calculated as percentage editing. Error bars are standard deviation. Significance: **P < 0.05 (two-tailed Student’s t-test). (c) Western blot analysis of titrated, 0 to 2.5 μg, ADAR1 levels (α-FLAG) during co-transfection with hNEIL1 or hNEIL1 ΔAlu in HEK293 cells. Detection of actin was used as a control for equal loading. RT-PCR, reverse transcription polymerase chain reaction.
