
Figure 10.
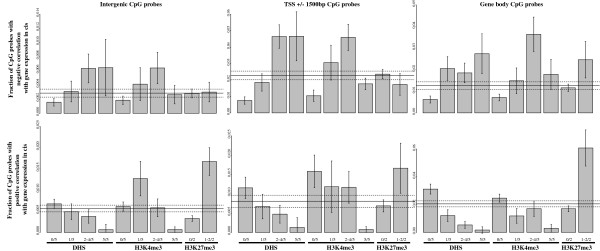
The proportion of CpG sites where methylation correlates with expression depends on the site location, DHS and histone marks. Proportion of CpG probes showing correlation with gene expression, ±95% confidence interval, for probes located in intergenic regions (left), within 1.5 kb of the TSS (middle), or within the gene body (right), and showing either negative (top row) and positive (bottom row) correlation, depending on the presence of DHS, H3K4me3 and H3K27me3. For DHS and H3K4me3 marks, the individual bars are based on the number (out of five) of ENCODE fibroblast cell lines that have the mark in question.