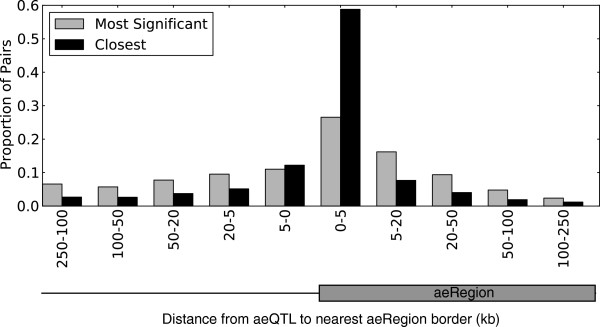
Figure 7.

aeQTLs are concentrated near boundaries of aeRegions. Distribution of the distance between aeRegion boundary and the SNP they correlate with (5% FDR). When an aeRegion’s allelic expression correlates significantly with more than one SNP, a single SNP is retained as having either the set of genotypes with the most significant correlation (gray bars) or being the most proximal to one of the two aeRegion boundaries (black bars).
