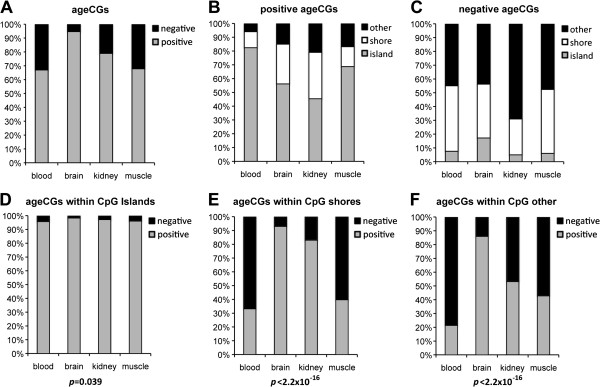
Figure 2.

Bar graphs displaying the percentages of ageCGs classified by CpG context and positive or negative association with age across four human tissues. (A) Percentage of total ageCGs that exhibited a positive or negative association with age in each tissue. (B,C) Percentage of positively associated (B) and negatively associated ageCGs (C) positioned within CpG islands, shores, or other. (D-F) Percentages of positively or negatively associated ageCGs each classified within CpG islands (D), CpG shores (E), or CpG other contexts (F). P-values are below bar graphs that resulted from Pearson’s Chi-squared tests between number of positive or negative associations across tissues in each respective CpG context.
