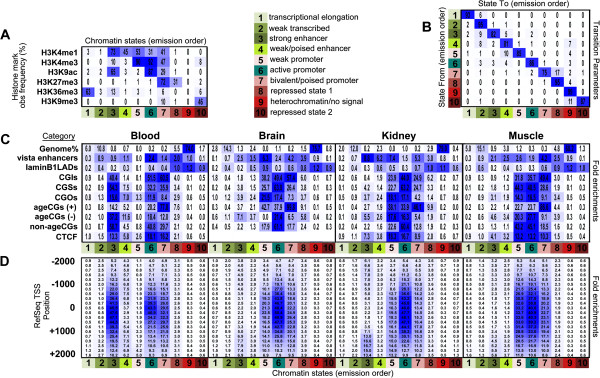
Figure 4.

Jointly learned tissue-specific chromatin states across four human tissues and functional enrichments within positive and negative ageCG positions. Ten input chromatin states using Roadmap Epigenome ChIP-seq data for six histone modifications across four human tissues were used with ChromHMM software. (A) Heatmap/table shows learned emission parameters based on genome-wide combinations of histone marks. Values indicate observed frequencies of histone modifications found at genomic positions corresponding with chromatin states. (B) Transitional parameter heatmap/table shows probabilities of transitions between states (multiplied by 100). Rows show the 'from' chromatin state and columns show the 'to' chromatin state, that is, a 17% probability that chromatin state 7 transitioned into state 8. (C) Heatmap/table depicts percentage of the genome for each chromatin state (topmost row) and relative fold functional enrichments of genome category (that is, vista enhancers, lamin B1 laminB1lads, CpGs within CGIs, CGSs, CGOs, positive (+) and negative (-) ageCGs and non-ageCGs). Enrichments for chromatin states underlying ChIP-seq CTCF binding sites were determined using ENCODE data for CD14+ and CD20+ cells (merged peaks blood), kidney tissue, and myotubes (brain data not available). Overlap enrichments were determined separately for each tissue using tissue-specific segmentation files generated from the jointly learned model. Values across rows indicate relative fold enrichment, and blue color scale is based on subtraction of the minimum value in the row divided by the maximum row value for each tissue separately (vertical black lines divide table enrichments per tissue). (D) Neighborhood enrichments for RefSeq transcriptional start site annotations (TSS) within chromatin states determined using default 0-based anchor coordinates for each start site position. Fold enrichment values and color scale are according to rows. In all panels, the lower axis shows chromatin state colored to match chromatin state descriptions (1 to 10).
