Fig. 5.
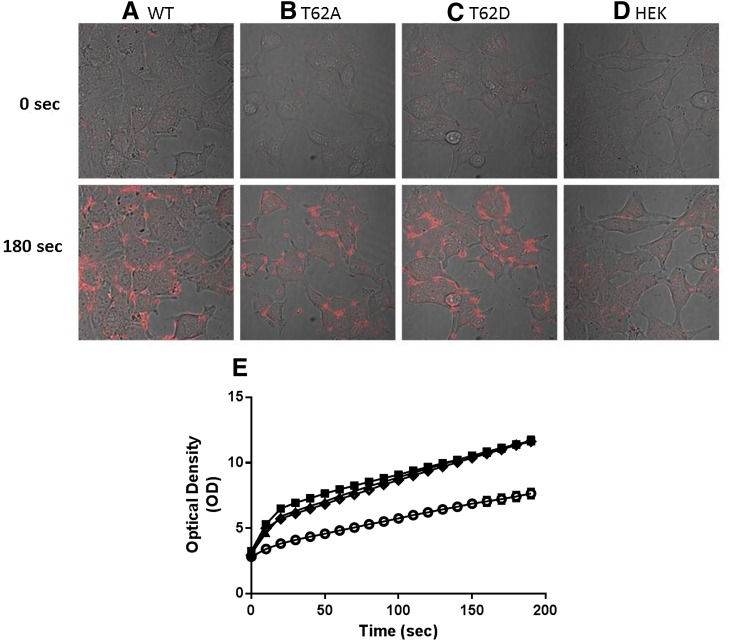
Accumulation of fluorescent substrate ASP+ in T62A- and T62D-hDAT HEK cells. Representative confocal images of time-dependent ASP+ accumulation are displayed in columns (A) WT-, (B) T62A-, and (C) T62D-hDAT, and (D) parental HEK cells. Acquired representative images of differential interference contrast and ASP+ signals are overlain, at times 0 and 180 seconds after exposure to 2 μM ASP+. (E) The optical density of the fluorescent signal was quantified in intracellular regions of WT- (▪), T62A- (▴), T62D- (◊) hDAT, and parental (°) HEK cells using ImageJ software. Data are plotted for the full 3-minute image acquisition of 10-second intervals; WT, n = 140 cells; T62A, n = 126 cells; T62D, n = 148 cells; and HEK, n = 148 cells.

