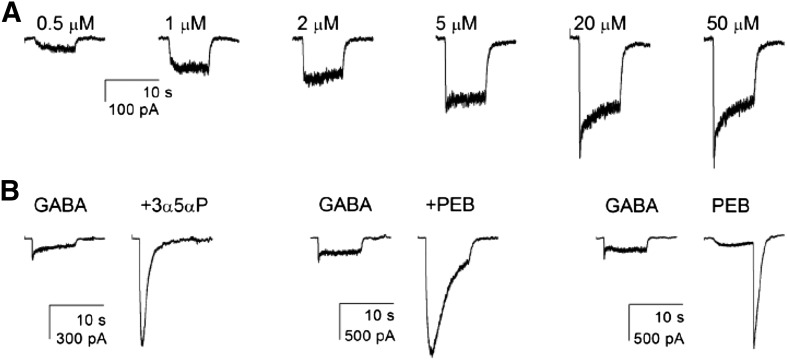
Fig. 3.
Summary of physiologic and pharmacologic responses. All recordings are from cells expressing wild-type α4-β2-δ receptors. (A) The response of one cell to increasing concentrations of GABA. The half-maximal response is between 2 and 5 μM. (B) Responses of three different cells. In the left pair, 50 μM GABA was first applied alone then in the presence of 1 μM of the neurosteroid 3α5αP. In the middle pair, 50 μM GABA was applied alone or in the presence of a low (potentiating) concentration of PEB (100 μM). The right pair shows the response of a cell to a maximal concentration of GABA (50 μM) and to 1 mM PEB. At this higher concentration of PEB, the response in the presence of PEB is reduced by channel block, whereas the large “tail” of current after removal of PEB shows the response of activated channels that have unblocked. Note that the tail is much larger than the maximal response to GABA. See Tables 3 and 4 for average values for all receptor types studied.

