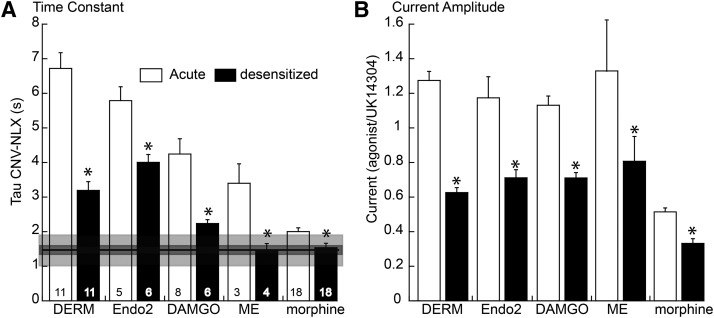
Fig. 4.
Summary of the results obtained for five agonists showing the increase in the rate of decline after desensitization. (A) Histogram of the time constant of current decay-induced photolysis of CNV-NLX (5 µM) for DERM (1 µM, same data as in Fig. 2), endomorphin-2 (Endo2; 1 µM), DAMGO (1 µM), ME (30 µM, same data as in Fig. 1), and morphine (1 µM). (Open bars) Measured at the peak current; solid bars are 10 minutes after application of the agonist, with the exception of morphine, which was after treatment of the animal for a week. In each case, the increase in the rate of decline after prolonged treatment (black bars) was significantly different from that measured at the peak. Horizontal line and dark and light gray boxes are the mean, S.E.M., and S.D. of the time constant of decline in the current induced by EC50 concentrations of low-affinity agonists (codiene, DAMGO, ME, DSLET, oxycodone, and morphine, taken from Banghart et al., 2013). (B) Histogram of current amplitude before and after desensitization with the indicated agonist (normalized to the current induced by UK14304, 3 µM). *P < 0.05 by unpaired Wilcoxon–Mann–Whitney rank sum test.

