Figure 2.

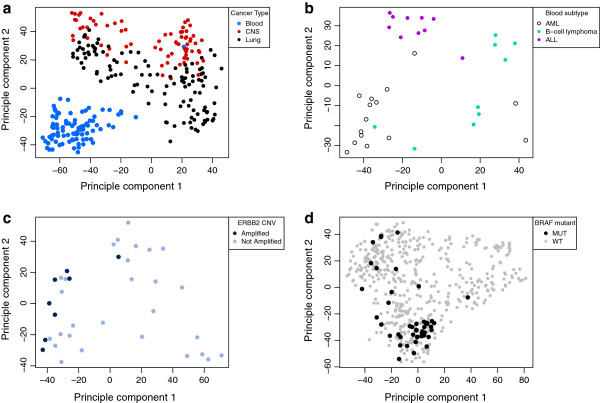
Whole-genome gene expression data capture molecular phenotypes in cancer cell lines. (a) Clustering of cancer types on principal component (PC) 1 and PC2 of a gene expression matrix from the CGP cell lines. There is clear clustering of blood, central nervous system and lung cancers. For clarity, only these three cancer types are shown here. Additional file 1: Figure S1 shows all cancer types. (b) Clustering of subtypes of hematological cancers on PC1 and PC2 of a gene expression matrix of CGP hematological cancer cell lines. For clarity only acute myeloid leukemia, acute lymphoblastic leukemia and B-cell lymphoma are shown here. All data is shown in Additional file 1: Figure S2. (c) Clustering of ERBB2 amplified breast cancers on PC1 and PC2 of a gene expression matrix of CGP breast cancer cell lines. (d) Clustering of BRAF mutated cancers on PC1 and PC2 of a gene expression matrix from all CGP cell lines. ALL, acute lymphoblastic leukemia; AML, acute myeloid leukemia; CGP, Cancer Genome Project; CNS, central nervous system; CNV, copy number variation; MT, mutated; PC, principal component; WT, wild type.
