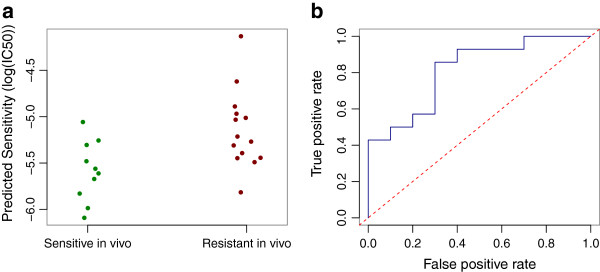
Figure 3.

Prediction of docetaxel sensitivity in breast cancer patients. (a) Strip chart showing the difference in predicted drug sensitivity for individuals sensitive or resistant to docetaxel treatment in vivo. (b) ROC curve showing the proportion of true positives against the proportion of false positives as the classification threshold is varied. ROC, receiver operating characteristic.
