
Figure 4.
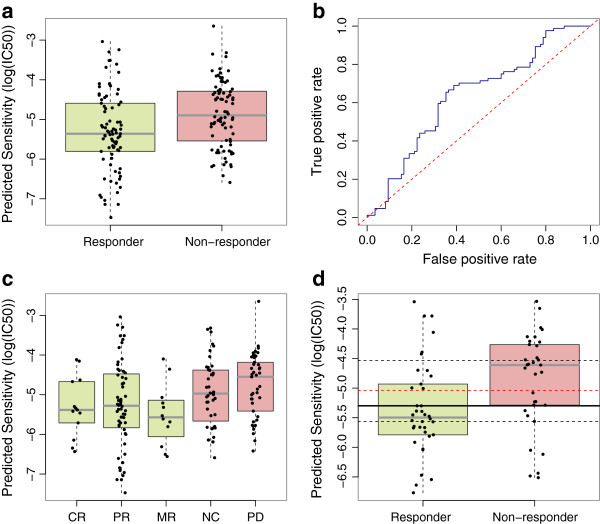
Prediction of bortezomib sensitivity in multiple myeloma patients. (a) Strip chart and boxplot of predicted drug sensitivity for in vivo responders and non-responders to bortezomib. (b) ROC curve illustrating estimated prediction accuracy. (c) Strip chart and boxplot with responders and non-responders further broken down as showing CR, PR, MR, NC or PD. (d) Strip chart and boxplot illustrating our predictions for the (039) arm of the bortezomib trial. The horizontal black line indicates the optimal cut-point, where classification accuracy is 72%. The horizontal dashed black lines indicate the range of cut-points for which classification accuracy is >63%, which was the accuracy reported for the trial-derived 100-gene signature on this dataset. The horizontal dashed red line is the mean IC50 value in the cell line training set, which could be used as an unbiased cut-point. CR, complete response; MR, minimal response; NC, no change; PD, progressive disease; PR, partial response.