
Figure 4.
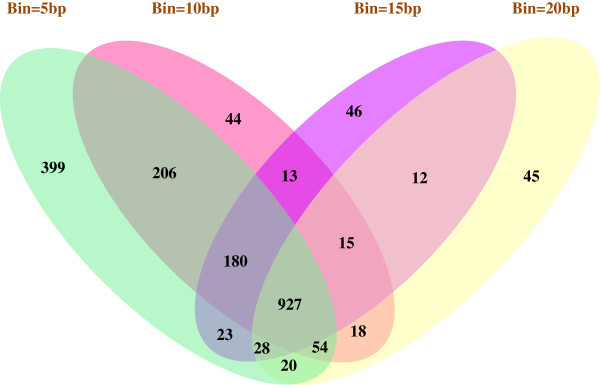
Sensitivity analysis of the bin size parameter. The four-set Venn diagram shows the overlap of the genomic regions that have stronger binding in the wild-type mouse than the miR-155 knockout mouse and have an average tag intensity of at least 30 in the wild-type condition, found by using different bin size parameters.