
Figure 6.
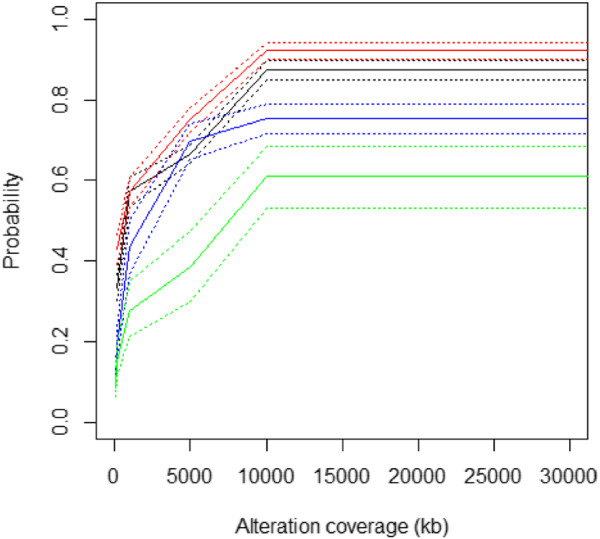
Coverage plots of candidate true positives to assess the sensitivity and specificity of alterations defined by the Infinium arrays. At each alteration threshold (deletion, blue; loss, red; gain, black; amplification, green) we counted the alterations that overlap between matched arrays. The number of overlapping regions (candidate true positives). Dotted lines represent 95% confidence intervals.