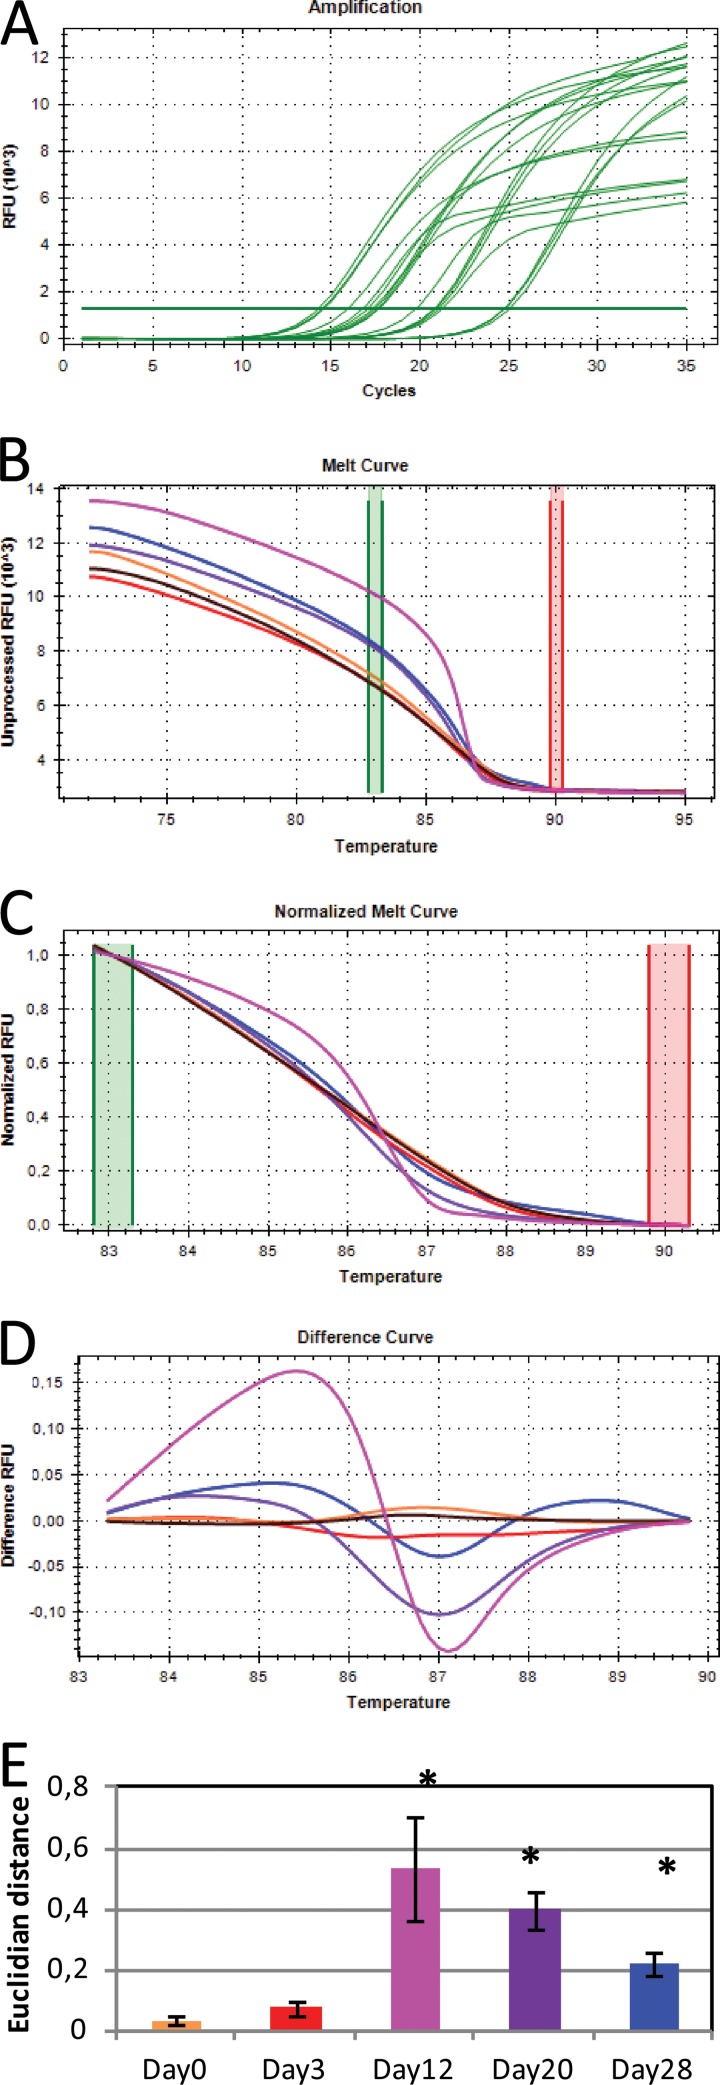
FIG 1.
Overview of the steps in 16S rRNA gene HRM analysis. Amplification and quantification of the 16S rRNA gene (A), melting of the PCR product in 0.1°C increments (B), normalization of the melt curves (C), conversion into difference curves in relation to control sample (black curve) (D), and average Euclidian distance between the different samples and the control (E) are shown. Note that the control sample was the H2O day 0 sample. Bars represent the means of triplicates from the Basamid GR samples. Error bars represent the standard deviations. In panels A to D, data for only one of the triplicate samples are shown for easier visualization. Asterisks represent sample means that were statistically different from the H2O day 0 samples (Tukey honestly significant difference [HSD]).

