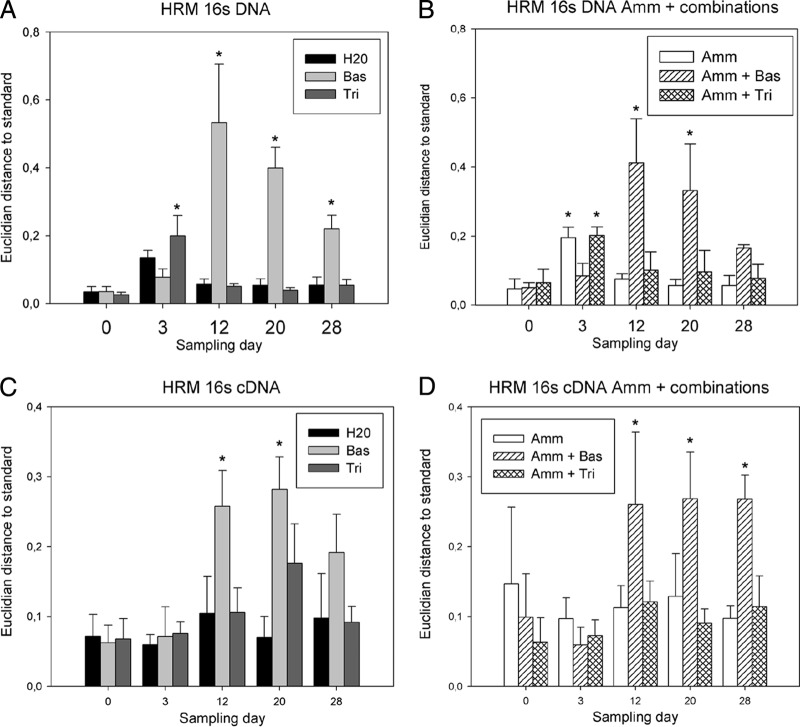
FIG 2.
HRM analysis of the bacterial community compositions of DNA samples (A and B) and cDNA samples (C and D). Treatments either did (B and D) or did not (A and C) include ammonium sulfate amendment. The data presented are the means and standard deviations of three replicates. The Euclidian distance, shown on the y axis, is the distance between the H2O day 0 samples and the respective sample. Asterisks represent sample means that were statistically different from the H2O day 0 samples (Tukey HSD). Bas, Basamid GR; Tri, Tridex DG; Amm, ammonium sulfate.

