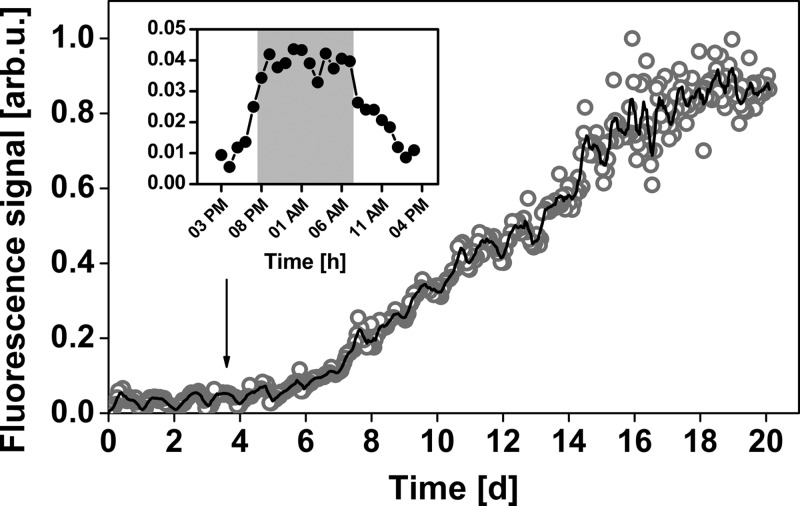
FIG 3.
Normalized fluorescence signal of long-term observation of biofilm establishment in the Baltic Sea (open circles) and moving average over 6 h (solid curve). The inset shows a typical day cycle of the fluorescence signal. The gray background marks the hours of darkness. arb.u., arbitrary units.

