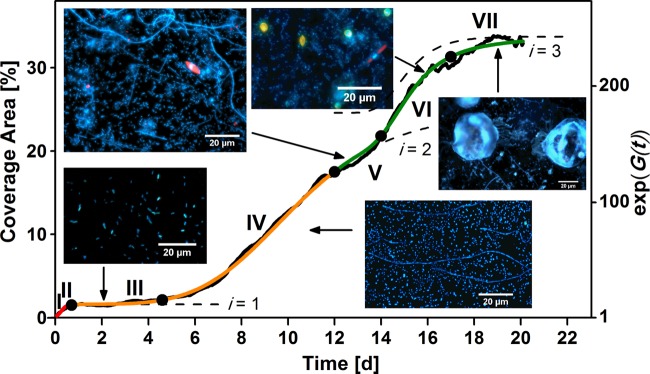
FIG 5.

Model of marine biofilm growth in the Baltic Sea fitted by three consecutive Gompertz functions (i = 1 to 3) with respect to coverage area. It is compared with data from the biofilm sensor recorded in October (black line). The colored lines (red, orange, and green) represent the three main stages of biofilm establishment, whereas the numbers indicate the seven main phases (I to VII) of marine biofilm formation dynamics. The dashed curves depict the contributions of the three biofilm formation stages, exp(gi), where i is 1 to 3. The insets show images of biofilm microorganisms stained with DAPI at five stages of establishment.
