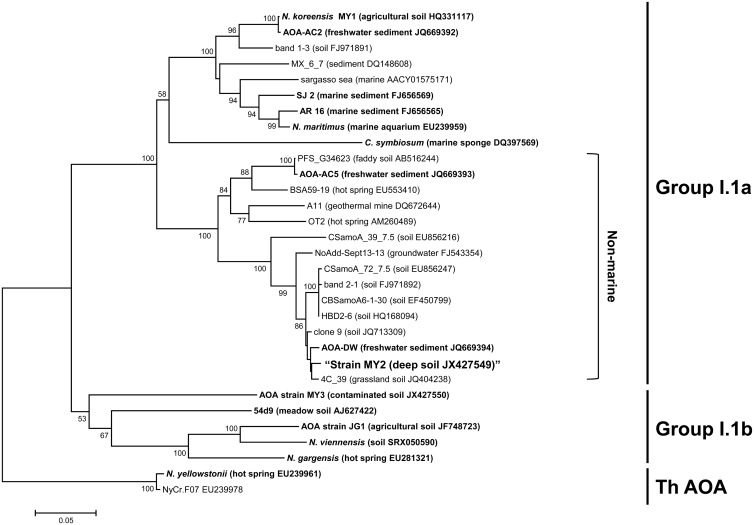
FIG 1.
Phylogenetic analysis of the archaeal amoA gene sequence (ca. 560 bp) obtained from strain MY2. The archaeal amoA genes were amplified using primers AamoAF and AamoAR. Branching patterns supported by >50% bootstrap values (1,000 iterations) according to the neighbor-joining method are denoted by their respective bootstrap values. The cluster groups are shown on the right, based on the origins of the reference sequences. ThAOA, thermophilic AOA lineage. The scale bar represents 5% estimated sequence divergence. Enriched or isolated AOA among the reference sequences are indicated in bold.

