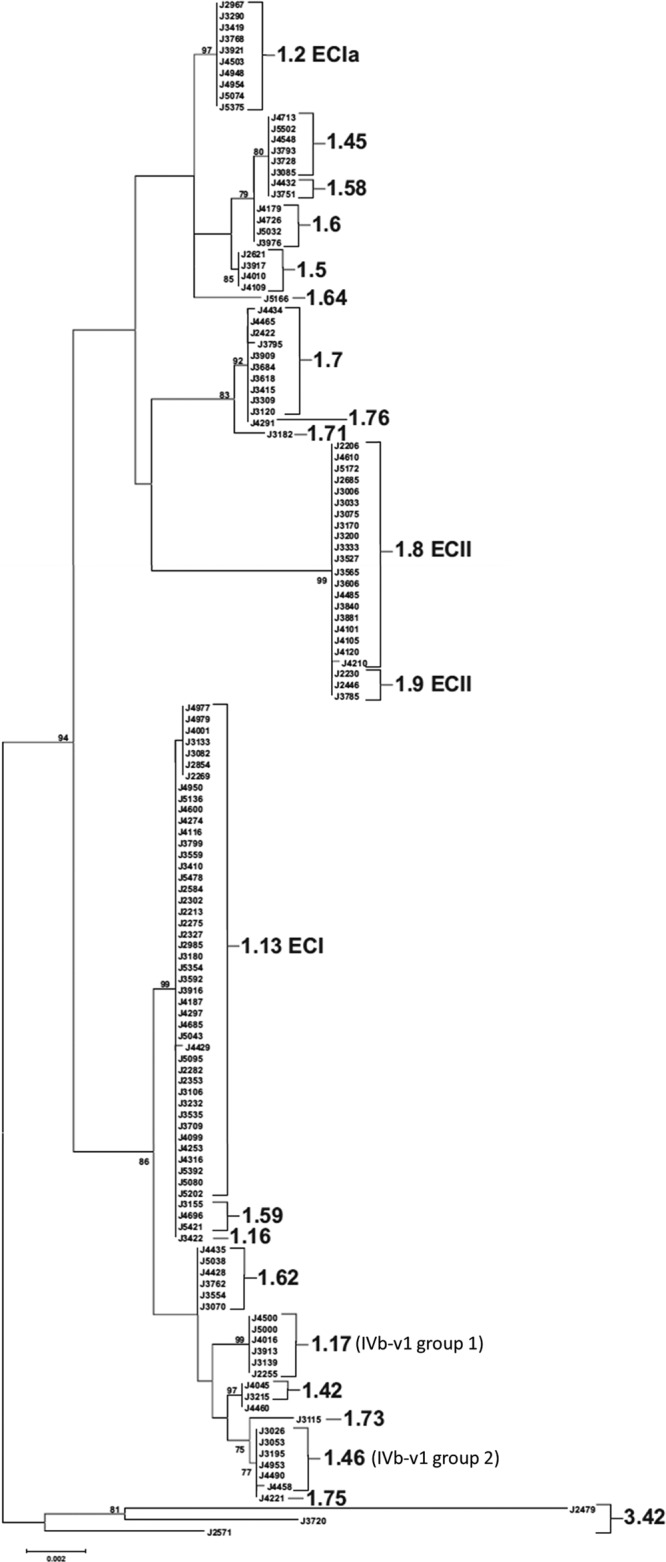
FIG 3.

Maximum likelihood tree inferred from analysis of inlAB sequences as described in Materials and Methods. MLGT results are shown to the right of individual isolates or clades, with the exception of J4460, which could not be fully typed using the MLGT method. Epidemic clonal groups are annotated according to Ducey et al. (13). The tree was rooted with sequences from lineage III strains. The frequency (%) with which a given branch was recovered in 1,000 bootstrap replications is shown for branches recovered in more than 70% of bootstrap replicates.
