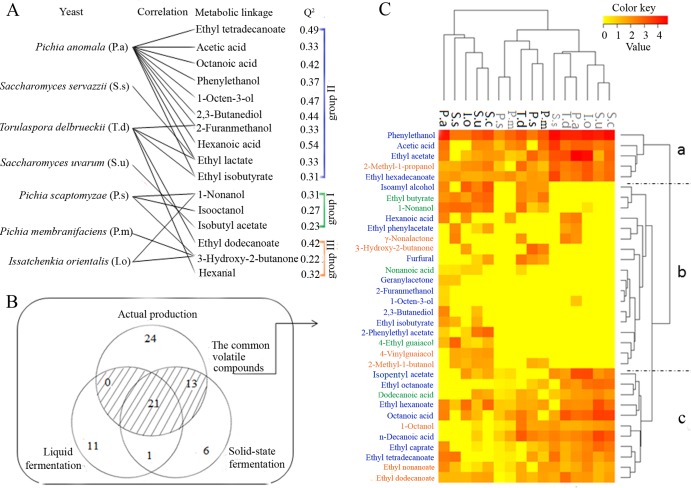
FIG 4.
(A) Volatile compounds that could be well predicted (Q2 > 0.2) on the basis of the yeast dynamics in the four fermentation batches by PLS regression. Associations with the volatile compounds are shown for each species of yeast that had a positive effect on the compounds. Groups I to III, labeled on the right, correspond to the groups used to illustrate the characteristic volatile compounds in the fermented grains generated by PCA (Fig. 3D). (B) Venn diagram outlining volatile compounds detected in the single-strain fermentations on a laboratory scale. (C) Comparisons of the volatile compounds produced by the different yeast species during the liquid (black) and solid-state (gray) fermentations. The Z score was used for data standardization by SPSS. The volatile compounds in group I, group II, and group III are in blue, green, and orange, respectively.

