
FIG 1.
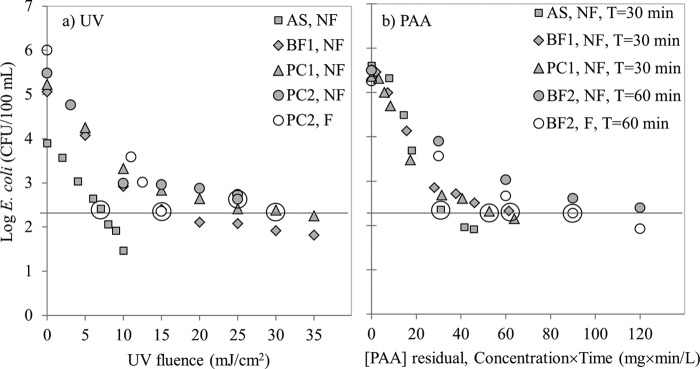
Effects of UV(a) and PAA (b). E. coli inactivation curves for nonfiltered (NF) samples from activated sludge (AS), biofiltration (BF1), and physicochemical (PC1) treatment plants. PAA contact time (T) was 30 min except for BF2 samples. The effect of particles on the inactivation kinetics was tested for UV on the PC2 plant samples (a) and for PAA on the BF2 plant samples (b); in both cases, nonfiltered (NF) can be compared to filtered (F) samples. The PAA contact time for BF2 was increased to 60 min for these experiments because of high consumption of PAA. Data points circled are those conditions for which E. coli isolation was done.