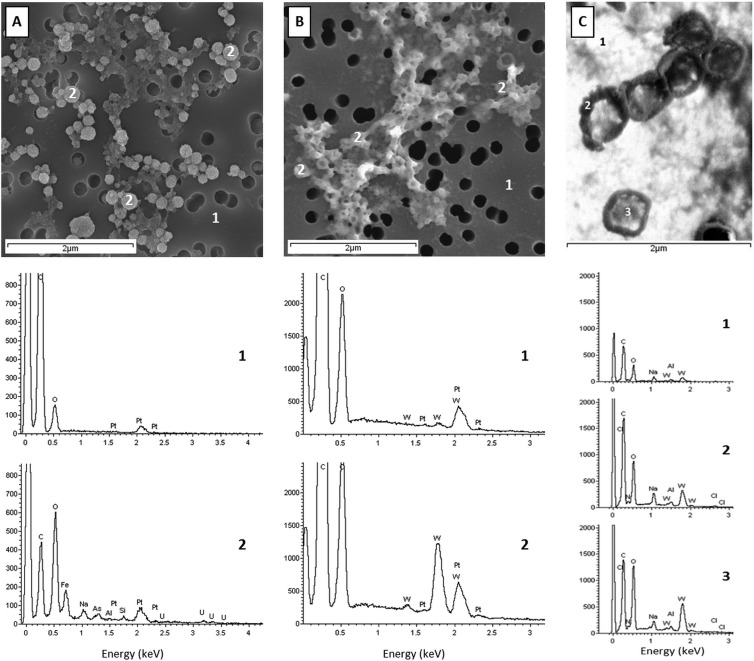
FIG 3.
EDS analyses of the brine ultrasmall cells. (A) EDS analyses of cells stained with uranyl acetate [UA; UO2(CH3COO)2·2H2O], pH 4 to 5; (B) EDS analyses of cells stained with UA followed by phosphotungstic acid stain (PTA; H3PW12O40), pH 0.4. Cells were fixed, stained, deposited on a polycarbonate filter, and coated with platinum. Numbers 1 and 2 mark the spots where EDS analyses were measured: 1, the background; 2, the cells. (C) EDS analyses during STEM observations of cells stained with PTA, pH 0.4, and deposited on a LuxFilm grid. Numbers 1, 2, and 3 mark the spots where EDS analyses were measured: 1, background; 2, electron-dense edge of the ∼0.2-μm cell; and 3, less electron dense in the middle of the cell. The weak nitrogen X-ray emission line is swamped by intense C and O signals, the latter due to the Fe,O coating. Elements identified by EDS: C, carbon; N, nitrogen; O, oxygen; Fe, iron; Na, sodium; As, arsenic; Pt, platinum; W, tungsten; Al, aluminum; Si, silicon; Cl, chlorine; and U, uranium.

