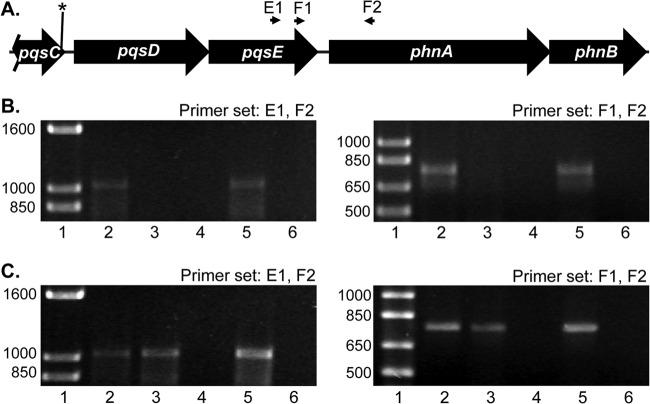
FIG 5.
Analysis of the pqsE and phnA transcripts by RT-PCR. (A) Diagram of the pqsD through phnB genetic region with location of the primers used for RT-PCR experiments. The asterisk indicates the location of the G1041A mutation in pqsC, of which only the 3′ region is shown. (B and C) Agarose gel with products from RT-PCR experiments performed with the indicated oligonucleotide primer pairs and RNA isolated from cultures grown in LB medium (B) or VBG (C). Lane 1 contains molecular size standards (1 Kb Plus DNA ladder; Invitrogen); size, in base pairs, is marked on the left side of each panel. Lane 2 contains reactions performed with chromosomal DNA as a template for positive-control reactions. Lanes 3 and 4 contain total RNA from wild-type strain PAO1, and lanes 5 and 6 contain total RNA from strain PAQC-G1041A. RNA was isolated from VBG at an OD660 of 0.2 and was used as a template for experimental reactions (lanes 3 and 5). For negative controls, reverse transcriptase was omitted from reactions shown in lanes 4 and 6.

