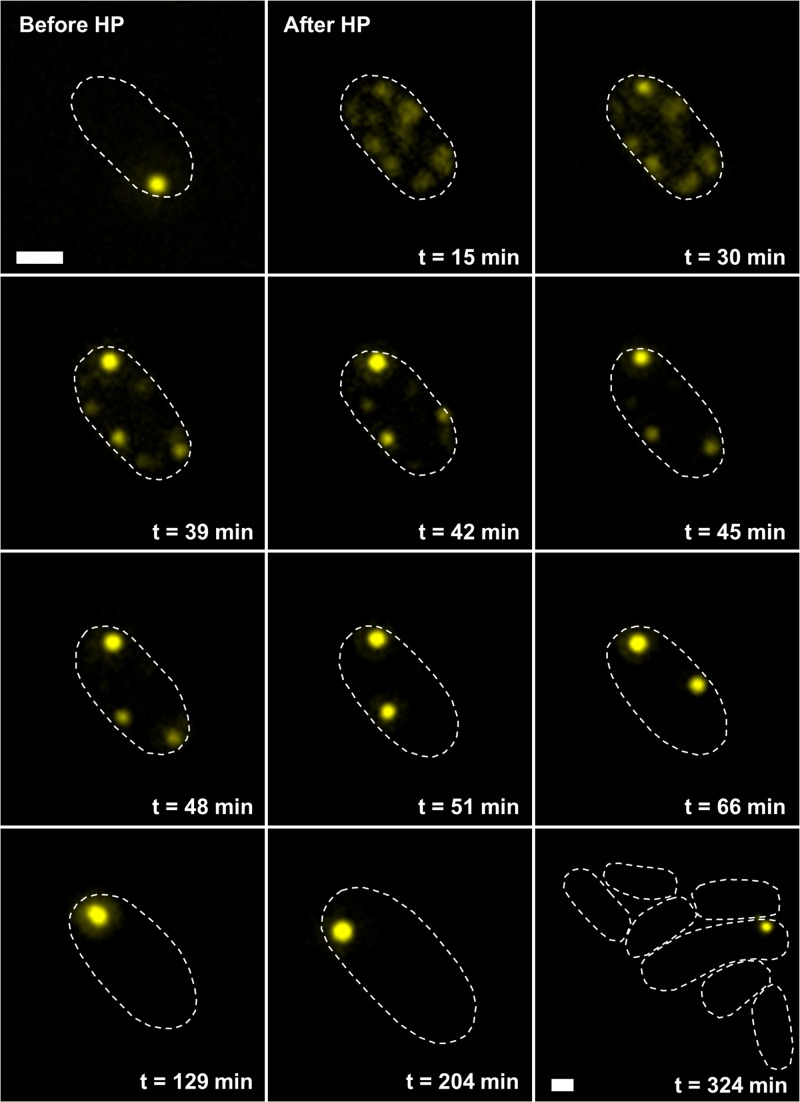
FIG 2.
HP-induced disassembly and reassembly of PAs in E. coli LMM1010 ibpA-yfp. Shown are representative images of a time-lapse fluorescence microscopy image sequence of the same cell before and after HP exposure (300 MPa, 20°C, 15 min), showing the reassembly of dispersed PAs into one larger polar PA and subsequent outgrowth of the cell. YFP epifluorescence images (reporting PAs) in combination with cell outlines are shown at the indicated times after HP exposure. The scale bars correspond to 1 μm.

