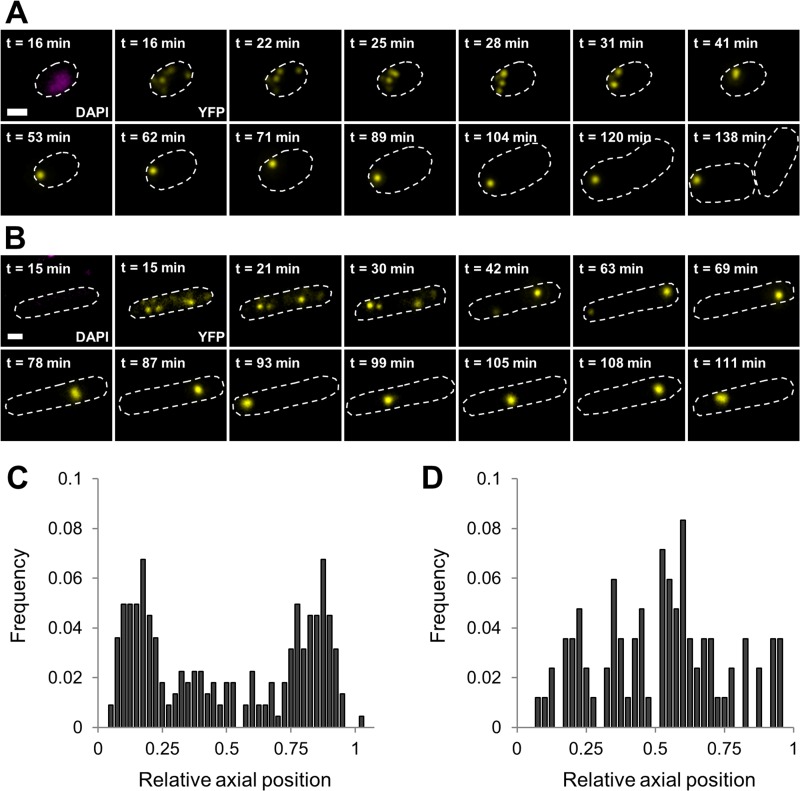
FIG 4.
Polar positioning of PAs is imposed by the nucleoid. (A and B) Representative images of a time-lapse fluorescence microscopy image sequence of a nucleoid-bearing LMM1010 ibpA-yfp cell (A) and an anucleate LMM1010 ibpA-yfp ΔrecA cell (B) after HP exposure (300 MPa, 20°C, 15 min). DAPI (reporting the nucleoid) or YFP (reporting PAs) epifluorescence images in combination with cell outlines are shown at the indicated times after HP exposure. The scale bar corresponds to 1 μm. (C and D) Binned histograms show the PA distribution along the relative axial position of the cells as detected in nucleoid-bearing LMM1010 ibpA-yfp (C) and anucleate LMM1010 ibpA-yfp ΔrecA (D) cells after PA reassembly after HP exposure (300 MPa, 20°C, 15 min) was completed. The average numbers of PA foci per cell were 1.18 for nucleoid-bearing cells (n = 224) and 1.00 for anucleate cells (n = 84).

