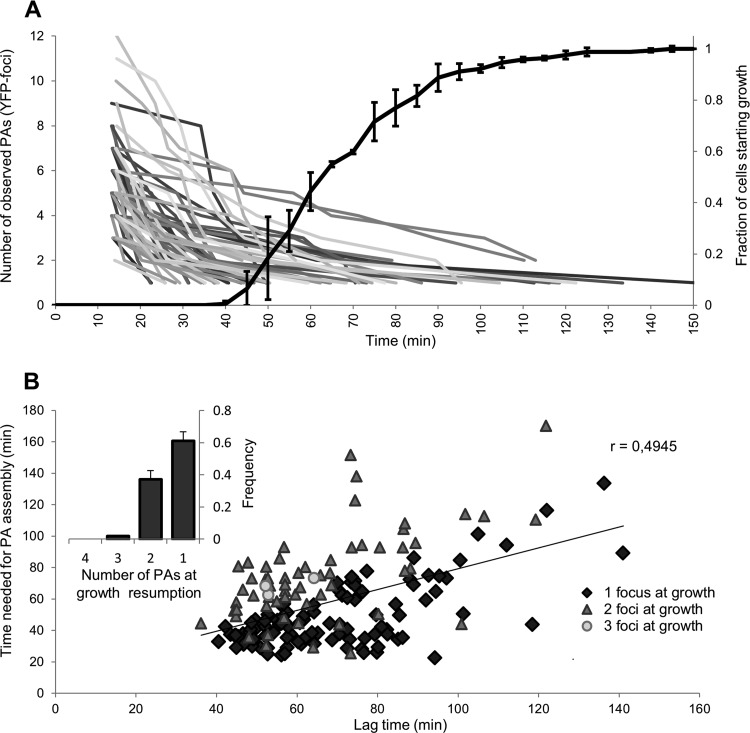
FIG 5.
Growth resumption is correlated with PA reassembly. (A) Cumulative lag time distribution of LMM1010 ibpA-yfp cells after HP exposure (300 MPa, 20°C, 15 min) was combined with the PA reassembly process in the same cells (n = 169; derived from three independent experiments). The time individual cells needed to resume growth after HP exposure was determined and binned to create the cumulative lag time distribution. The mean cumulative lag time distribution of three independent experiments is shown with error bars representing the standard deviation per bin. At the same time, the number of individual PAs (visible as IbpA-YFP foci) inside these cells was monitored. Every line represents the PA assembly process of a single cell. Because of visibility, not all of the monitored cells are included. (B) Correlation between the time a cell needs to reassemble its PAs and its corresponding lag time, based on the data set from panel A. A subdivision was made depending on the number of larger PAs a cell assembles its dispersed PAs into prior to resumption of growth. The linear regression line (trend line) and Pearson's correlation coefficient (r = 0.4945, P = 2.35 × 10⁻¹¹) are based on all cells together. (Inset) Fraction of cells resuming growth after HP treatment when PAs are reassembled into one, two, or three larger PAs. The means of three independent experiments are shown with error bars representing the standard deviation.

