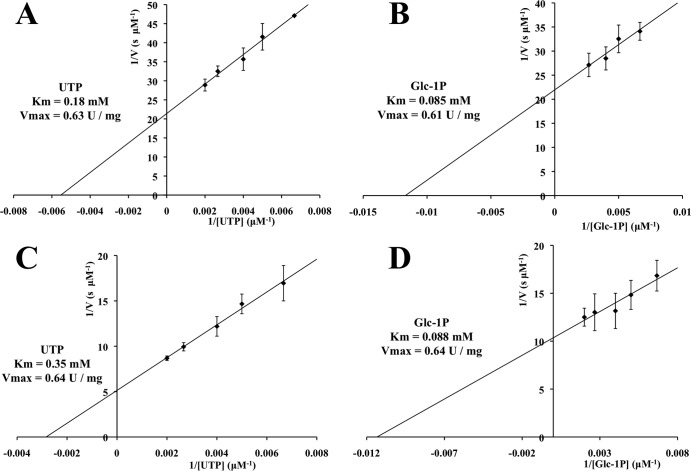
FIG 3.
Lineweaver-Burk plots of the enzyme activity of Sll1558 (A and B) and A8G-Sll1558 (C and D). As a fixed substrate, 1 mM Glc-1P was included in the experiments for panels A and C, or 2 mM UTP was included in the experiments for panels B and D. Protein concentrations: 4.5 μg ml–−1 (A and B), 18.0 μg ml−1 (C), and 9.0 μg ml−1 (D). The error bars indicate standard deviations (for A, B, and C, n = 3; for D, n = 6).

